 |
|
|
|
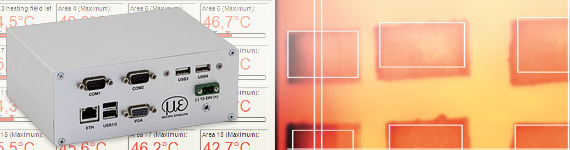
Industrial PC for thermoIMAGER TIM
|
|
|
|
TIM NetPC is a professional, embedded industrial PC solution with a passive cooling (fanless) for thermoIMAGER applications and is suitable for top hat rail mounting. The NetPC and the TIM camera operate in combination as a standalone system, enabling extended cable lengths (via Ethernet). Data provided by the TIM camera can be stored directly on the NetPC where customer-specific software can also be installed. |
|
|
Characteristics
Supports all thermoIMAGER TIM models
Processor: Intel® Atom™ 2600 @ 2x1.6 GHz Dual, 2 GB DDR3 RAM 800 MHz
Supports 120 Hz (TIM 160), up to 70 Hz (TIM 4x0), up to 30 Hz (TIM 640) frame rates
Ports: 1 Gbit/s (Gig E), 2 x RS 232, 4 x USB 2.0, VGA
Operating system: Windows 7 embedded
Including TIM Connect software
Monitor via VGA (analog)
Integrated watchdog feature
|
|
|
|
|
 |
|
|
|
|
|
|
Thermal imaging cameras for metals
|
|
|
|
The short-wave thermoIMAGER TIM M-05 and TIM M-1 thermal imaging cameras are mainly used in the metal processing industry. Due to its short-wave measuring wavelength, these infrared cameras are ideal for temperature monitoring during melting, hardening and forming processes.
|
|
|
|
|
|
|
Compact infrared camera temperature measurement of molten metal – thermoIMAGER TIM M-05
|
|
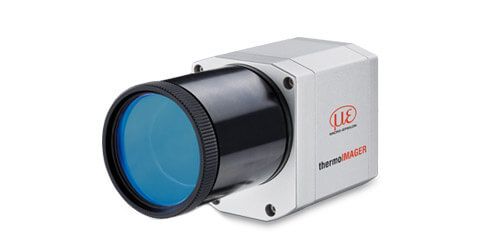
The thermoIMAGER TIM M-05 thermal imaging camera is designed for non-contact temperature measurement of molten metal and metallic surfaces from 900 °C to 2450 °C. As well as compact size, USB interface and license-free software, the new TIM M-05 series features a wavelength range of 500nm to 540nm minimizing measuring errors due to unknown or changing emissivity. The frame rate of 1kHz and high optical resolution enable optimal adaption to the respective application.
|
|
|
|
|
|
Compact infrared camera for temperature measurement of metal surfaces – thermoIMAGER TIM M-1
|
|
The thermoIMAGER TIM M-1 thermal imaging camera is designed for non-contact temperature measurement of hot metals in the 450°C to 1800°C range. As well as the well-known advantages of thermoIMAGER infrared cameras such as their compact size, USB interface and license-free software, the new TIM M-1 series offers several unique selling points. Compared to other thermal imaging cameras for metals, the temperature measuring range of 450°C to 1800°C is usable entirely and without sub-ranges. There is no need for any measuring range switchovers and the camera is significantly more flexible in its use.
|
|
|
|
|
The powerful sensor electronics not only enable process thermography but also the output of temperature data of the center pixel at 1kHz and so can also be used as a pyrometer. The TIM M-1 thermal imaging camera is primarily used for temperature monitoring of hardening and forming processes for hot metals but also for processing graphite and ceramics. |
|
|
|
|
 |
|
|
|
|
|
|
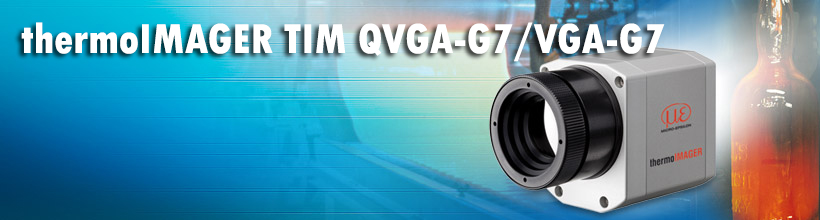
Thermal imaging cameras for glass
|
|
|
|
The thermoIMAGER TIM QVGA-G7 / VGA-G7 is an industrial thermal imaging camera specially designed for applications in the glass industry. The spectral range of 7.9 µm enables reliable measurements even on thin glass sheets. If the glass has a reflection coating, an additional reference pyrometer can be integrated in order to readjust the thermal imaging camera. Like all thermoIMAGER TIM cameras, the G7’s license-free analysis software includes a line scan feature that enables the monitoring of thermal processes, even if the field of vision is restricted.
|
|
|
|
|
|
|
|
|
 |
|
|
|
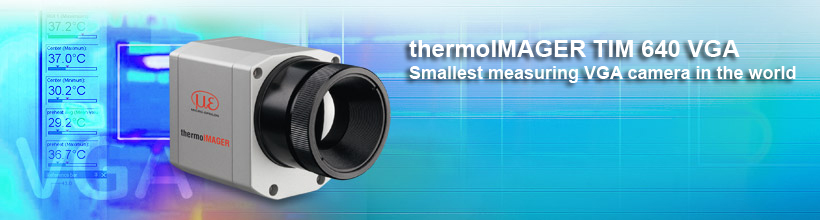
Smallest VGA infrared camera in the world – thermoIMAGER TIM 640 VGA
The thermoIMAGER TIM 640 infrared camera is the smallest VGA-resolution thermal imaging camera in the world, providing thermal images in real time due to its optical resolution of 640 x 480 pixels. With dimensions of 46x56x90mm and weighing just 320g (incl. optics), the thermoIMAGER TIM 640 is one of the most compact thermal imaging cameras on the market. The scope of supply includes the extensive TIM Connect analysis software.
Measuring ranges: -20 to 100°C / 0 to 250°C / 150 to 900°C
Optical resolution 640x480 pixels
Spectral range: 7.5 – 13 µm
Excellent thermal sensitivity (NETD): 75 mK
Lenses: 15°,33°, 60°,90° FOV
Image recording in real time at 32Hz
Supply and operation via USB
Extremely lightweight, robust and compact
Analog input and output, trigger interface
Protection class IP67
|
|
|
|
|
 |
|
|
|
Integration into application software
The scanCONTROL sensors record a profile from individual calibrated points for each measurement. These profiles can be used individually or combined in a container set, and transferred to your own applications as an array or matrix. In addition to the data transfer of individual measuring points and their additional information (e.g. intensity, counter reading) the entire configuration of the sensor can also be controlled from its own application software.
In order to access the functions for configuration and data transfer, Micro-Epsilon offers different tools:
|
|
|
|
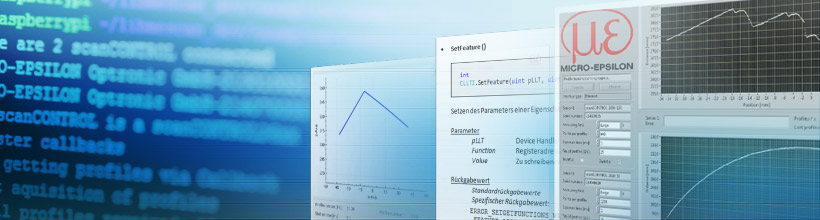
scanCONTROL Developer Tool as integration example |
|
The scanCONTROL Developer Tool is designed to help developers integrate the scanCONTROL sensors into their own application based on the scanCONTROL SDK (LLT.DLL):
-
Complete integration example with source code
-
MouseOver feature for the scanner parameters displays the associated DLL function
-
Read and write access to the sensor registers
-
Visualization of all available transmission modes for scanner data
|
|
|
|
Integration using the SDKs for C/C++ and C#
|
|
The C/C++ library for scanCONTROL supports both static and dynamic loading. Both stdcall and cdecl are supported as calling conventions. The individual functions of the library are clearly documented in the interface description and explained using examples.
The scanCONTROL SDK integration package includes:
-
LLT.DLL library file
-
Documentation for interfaces and scanCONTROL
-
Interface for C#, Python and VB .NET
-
Numerous programming examples for C++ and C# (e.g. trigger and container mode)
|
|
|
|
Integration in LabVIEW
|
|
The scanCONTROL instrument driver LabVIEW supports fast integration of scanCONTROL sensors into National Instruments LabVIEW. For accessing a scanCONTROL sensor and its basic settings, users can drag-and-drop modules directly from the function palette into their VIs. Example VIs illustrating the scanCONTROL integration are also part of this package.
The integration of scanCONTROL sensors into the LabVIEW environment is based on the C/C++ library (LLT.DLL) of Micro-Epsilon. Detailed documentation also shows how to set up additional special sensor parameters.
The scanCONTROL instrument driver for LabVIEW:
-
Developed according to the LabVIEW instrument driver guidelines by National Instruments
-
LabVIEW 2012 and higher supported
-
Comprises instrument drivers for 32Bit and 64Bit
-
Fast and easy access to all settings via function palette
-
Ethernet interface supported
-
Example VIs
-
Detailed documentation
|
|
|
|
|
|


 Measuring ranges from 450 °C to 2450 °C