|
|
 |
|
|
|
LDM-PCEX2 - Laser Diameter Measurement System
|
|
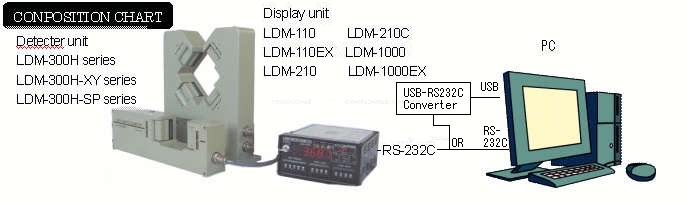
LDM-PCEX2 is a software application that takes the result measured using Takikawa's laser diameter from the display part into the PC by serial communications (RS-232C), and to file the graph print and the measurement result
Encoder system unit (option)
This unit greatly enhances the function of the LDM-PCEX2:
・ Start/Stop of measurement data recording can be done by external switch , output , reading of a rotarly encorder.
・This has USB <-> RS-232C converter . Even if PC has no RS-232C , connectable by USB cable.
Quality Control Application
The application reads the data acquired by LDM-PCEX2 and creates a quality control valiue and various graphs. The process variation.of the products can be grasped and can be judged objectively with a quality control index.
|
|
SPECIFICATIONS
|
|
Model |
LDM-PCEX2 |
|
PC/OS to be used |
Meet the forrowing requirement. |
|
IBM PC compatible (DOS/V machine): CD-ROM should be able to be used.
USB port or a parallel port is installed in the main body, and operate.
|
|
Microsoft Wndows Vista(checked by 32bit type), 7 (32bit/64bit) , 8 (64bit) ,8.1(64bit)
*(Checked only Japanese Version)
|
|
Corresponding Model |
Connected by TAKIKAWA's LASER DIAMETER |
|
Communication Rate |
An initial value is 9600bps. |
|
Data Bit Length |
8bits |
|
Stop Bit Length |
1bit |
|
Parity Bit |
None |
|
Function |
Measurement Value Display, Peak value display, Measurement value state display
Data writing , Graph Drawing and printing function.
|
|
Store file format |
CSV style(text file) |
|
|
Type |
Encorder system unit (Option) |
|
Max. clock frequency |
2kpps |
|
Count sensor power supply |
DC+12V Max80mA |
|
Relay contact("a" contact, AC250V Resistance load 2A) |
|
Monitor output |
|
Communication |
PC side: USB B type LDM display side: RS-232C |
|
Power supply |
AC100 - 240V Free power supply 50/60Hz, 3VA or less |
|
Ambient condition |
Temperature:0 - 45 degree centigrage,
Humidity:35 - 85%RH(No condensation) |
|
Weight |
Estimated: 470g
|
|
Outside dimention |
140(W) * 60(H) * 100(D)[mm] |
|
|
|
Quality control application |
|
Measurement Display |
Displays acguired measurement data as graph:
-
Displays all maximum/minimum in every section in display.
-
The average value plot of each section
|
|
Histogram |
It is possible to see the variation state of measured value visually. |
|
Quality Control Index |
Calculated values, such as the maximum/minimum, an average / standard deviation value, distribution/deviation, and a process capability index (Cp/Cpk), are displayed. |
|
Graph display |
Selection is arbitrarily possible in display ch selection convenient to print or a plot color. |
|
|
|
|
* In Windows vista,7, 8, 8.1 the company name and the product name that has been described to Microsoft Corporation and other this papers are the registered trademarks or trademarks of each company.
* The specification is a previous notice and might change.
Example of screen under measurement when LDM-110EX is used
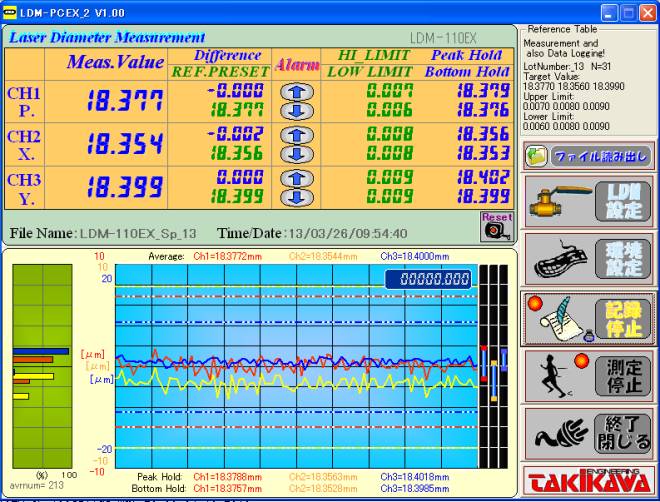
Example of screen of making it draw to simultaneous 3 channels in graph
|
|
|
|
Example of the use of an encoder system unit
・The ability to count pulses from the rotary encoder is added by using an optional encoder system unit. The horizontal axis of the graph generally is time display, by using this option, it is possible to display the horizontal axis of the graph distance is possible.
RS232C port is also provided together can also be connected to the LDM display unit.
Constitution
Connected as shown below each device and the encoder system unit.
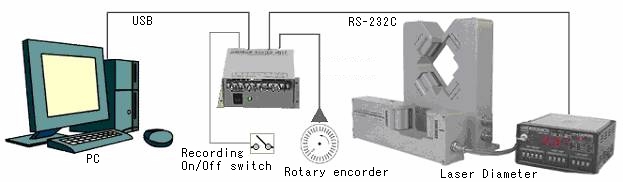
・Rotary encorder and recording On/Off switch can be connected in accordance with the needs of customers.
|
|
|
|
|
|
Product & Technology News
LDM Series
Download Catalogue
|