


Measurement data analysis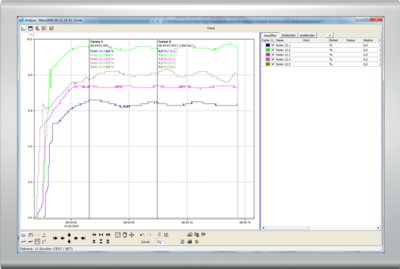 Simple operation means requirements quickly met Use drag & drop to select the required channels and immediately portray online time signals in the diagram format required. Any signal from the Message and Expert series can then be directly portrayed on up to four y-axes. There is also the option to display digital signals within logic diagrams. The trend is then split with a window available for digital signals. This allows analog and digital signals to be analyzed simultaneously. Functions also include cursor and statistical features as well as marker and CSV export for additional analysis, e. g. in Microsoft Excel or National Instruments Diadem. ProfiSignal Go has adapted the zoom feature from the Adobe Reader to enable fast orientation when using trends. |
|
|
|
Calculation channels An integrated formulae manager enables measurement data from Expert or Message series to be computed online and offline, and for the results to be stored as well as portrayed in diagrams. Complex efficiency formulae as well as basic temperature or pressures averaging are simple to implement. Data storage that eliminates the divide between online and offline analysis Intelligent data storage enables direct access to extended time ranges even for archived data. Users need only to click on the time axis and select the required time range. ASCII export at just a few clicks Use cursors to select a time range within a diagram and then export the data to a data file for processing by ProfiSignal, or as a CSV file for further processing with, for example, Microsoft Excel or National Instruments Diadem. To export the entire data requires just two mouse clicks to store the data as an ASCII file to a hard disk. |