


Measurement data analysis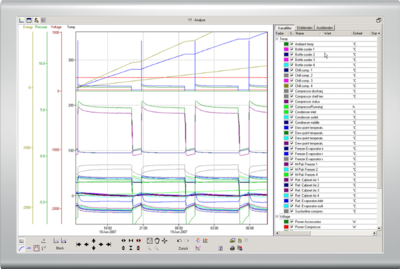 ProfiSignal Basic enables measurement dataanalysis directly at the visualization user-interface and/or within individual diagrams irrespective of the application. ProfiSignal Basic provides trends (y(t)- and logic diagrams) and characteristic curves (y(x)-diagrams) and – in addition to those available from ProfiSignal Go – many visualization objects such as buttons, switches, analog and digital displays, and signal lamps. |
|
|
|
Measurement data visualization and analysis in a single system Visualization and analysis of data acquired with Expert or Message devices takes places directlyonline within the user-defined visualization-objects and diagrams incorporated into the user-interface. A full screen mode is also available for the individual diagrams. Switching or ending visualization is unnecessary here. Functions also include cursor and statistical features as well as marker and CSV export functions enabling additional analysis, e. g. in Microsoft Excel or National Instruments Diadem. ProfiSignal Basic has adapted the zoom feature from the Adobe Reader to enable fast orientation when using diagrams. Calculation channels An integrated formulae manager enables measurement data from Expert or Message series to be computed online and offline, and for the results to be stored as well as portrayed in diagrams. Complex efficiency formulae as well as basic temperature or pressures averaging are simple to implement. Data storage that eliminates the divide between online and offline analysis Intelligent data storage enables direct access to extended time ranges even for archived data. Users need only to click on the time axis and select the time range. |