


Visualization, operation, analysis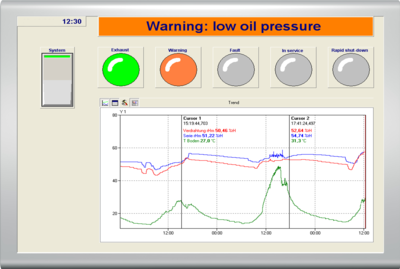 |
|
|
|
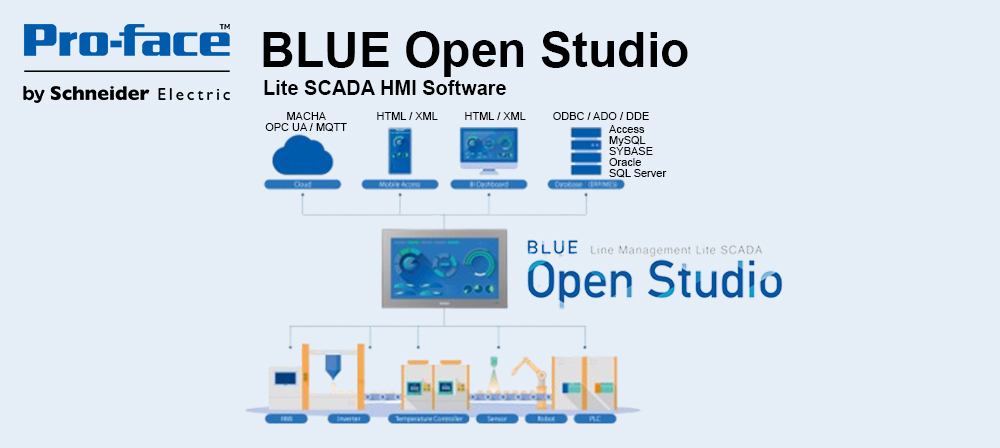
Visualization objects such as text input fields, switches, buttons, slide and rotary controls are available for operation as well as for the visualization of processesand data. Operating objects, such as displays and diagrams, are placed on the visualization display and linked to the appropriate Message or Expert device channels. It is also possible to directly link objects to analog or digital outputs, or to enter parameters such as threshold values that can then be further processed within the Message devices, e.g. to generate alarms for ProfiSignal's alarm management option. Diagrams can also be incorporated alongside operating objects such as switches and rotary controls. Any diagram such as trends (y(t)), characteristic curves(y(x)), FFT, cascade FFT and orbit diagrams can be incorporated into the visualization. Any function can then be performed during process runtime irrespective of whether it concerns averaging for a long-term analysis, or data export to Excel from the previous half hour runtime, or from the latest experiment. Diagrams can be switched from visualization to full screen mode giving access to all measurement data analysis functions for both online and archived data. |