


Visualization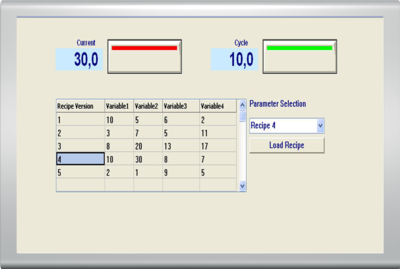 ProfiSignal Basic enhances ProfiSignal Go ProfiSignal Basic offers more than just the portrayal of online and archived measurement data as diagrams. ProfiSignal Basic extends ProfiSignal Go withvisualization components. With the aid of visualization components, users can generate their own professional systems to visualize fill levels, temperatures, humidity or pressures etc. Users must not however forego the benefits of ProfiSignal Go and its diagram portrayals. Still available are diagrams (y(t), y(x), FFT, etc.) and the digital and analog displays. |
|
|
|
Fast visualization through clear object layout Objects such as digital and analog displays as well as tanks, images and operating objects are placed on the visualization display and linked to the appropriate Message or Expert device channel. Displays show measurement data even in development mode and enhance working procedures. To maintain clarity and avoid visualization overload, the range of available objects are limited to those that are really needed. The objects are clearly sorted into groups to enable users to find display elements such as digital and analog displays or signal lamps and diagrams. Operating objects such as switches, button and input fields, are sorted into other groups. |