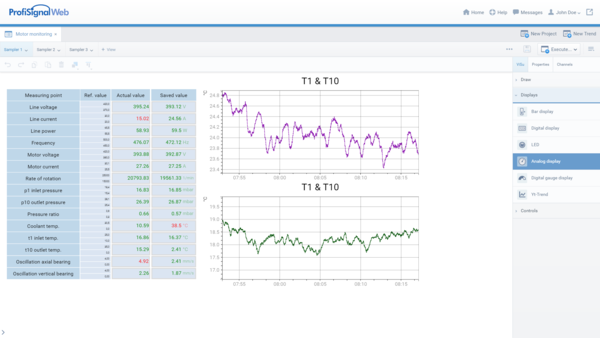
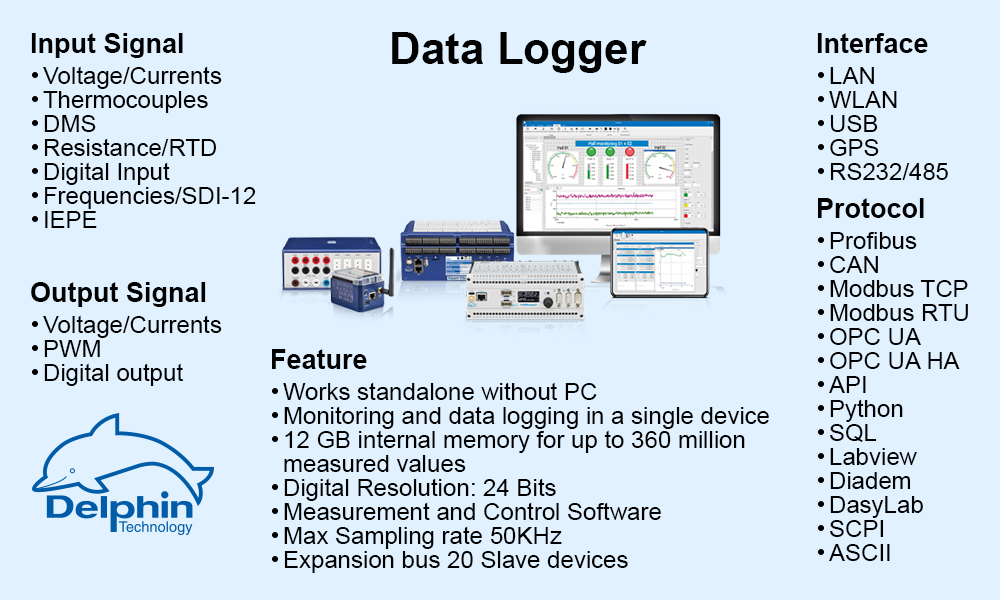
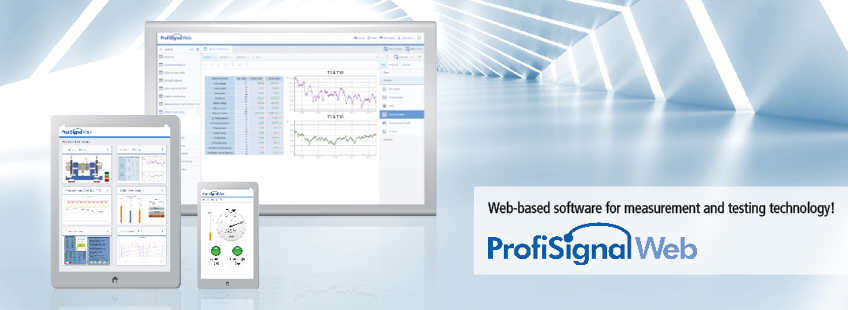
ProfiSignal Web enables measurement data to be visualised on desktops, notebooks, tablets or smartphones. Visualisation is based on HTML5 and therefore platform-independent, compatible on any user device, and requires no special client software.
For complex monitoring requirements
The client/server application has been optimised to enable visualisation of complex processes. Views can be individually created using a multitude of display elements. Input elements are also available for operating and controlling processes and can be used to set channel values and regulate outputs.
Live and historical data
Measurement data can be visualised extremely quickly using the new ProfiSignal Web software. It enables live and historical data to be optimally portrayed in trend diagrams. Portrayal is extremely fast even for the processing of extended time periods.
Other products highlights
Individually designed dashboards for key measurement data
Multiple users can access the same project simultaneously
Access rights can be adapted and regulated according to specific project requirements
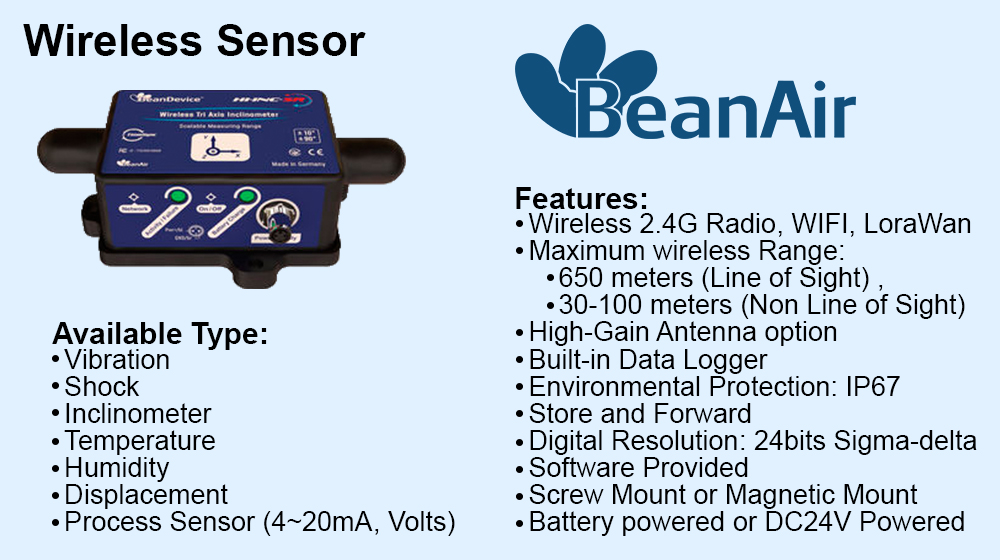
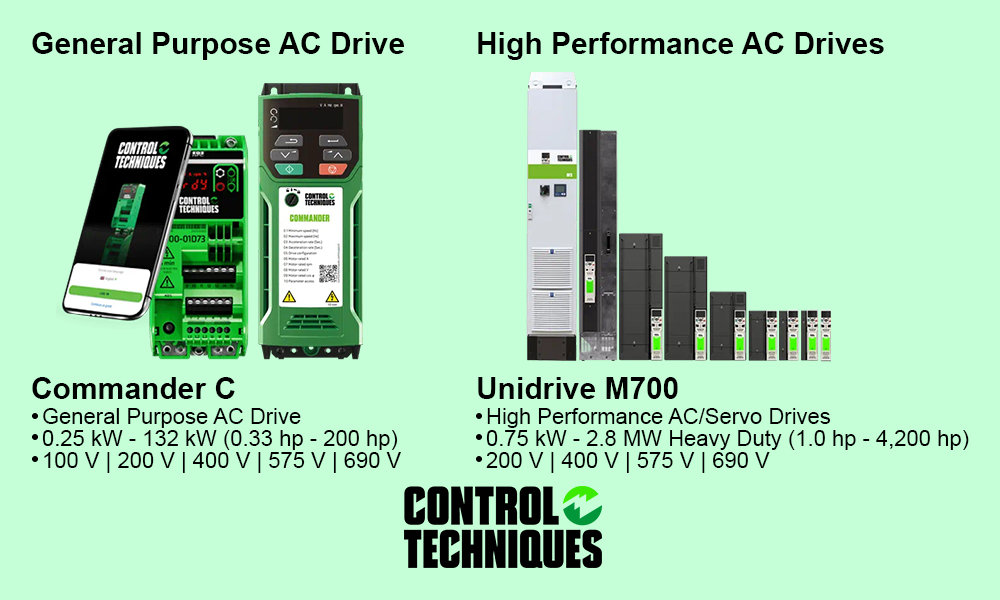
A diverse range of interfaces enable compatibility to a multitude of intelligent sensors and components from third-party providers
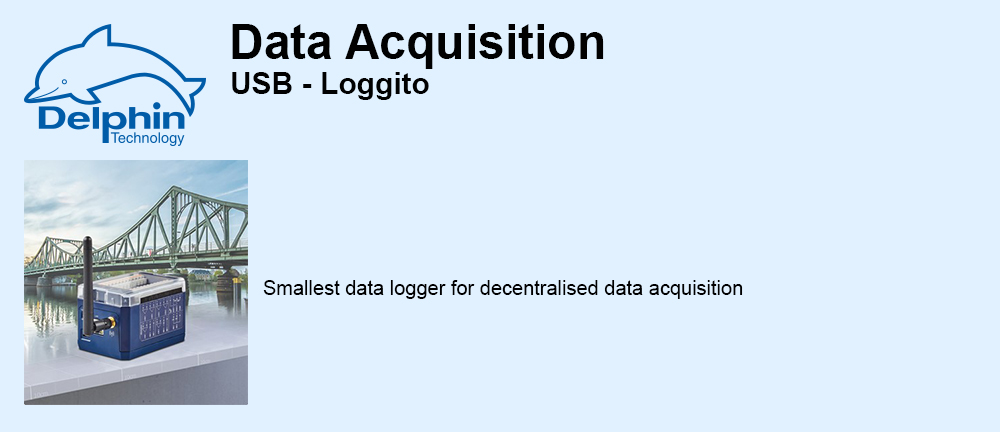
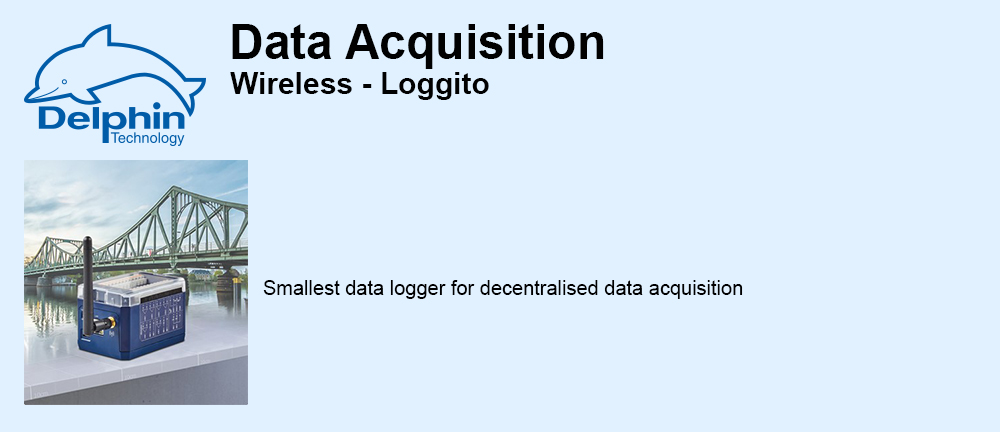
ProfiSignal Web is fully compatible with the compact Loggito series and together provide a complete package


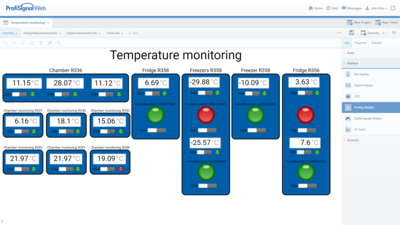
 Individually designed dashboards for key measurement data