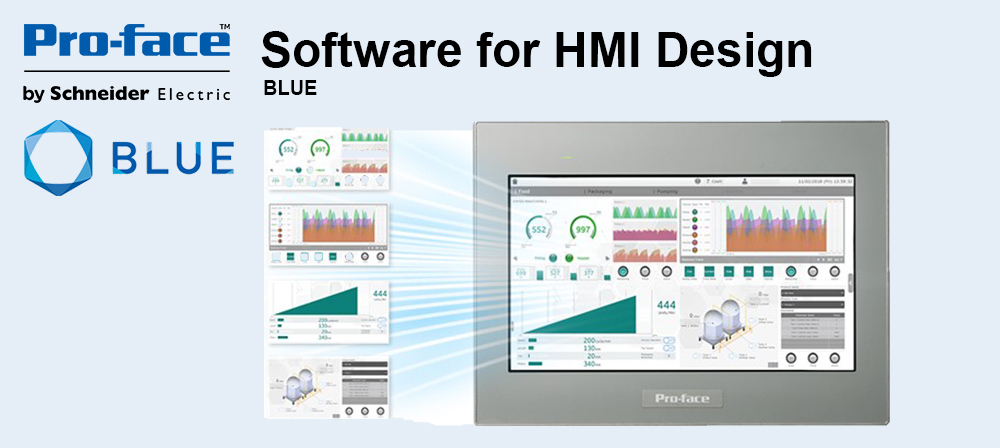
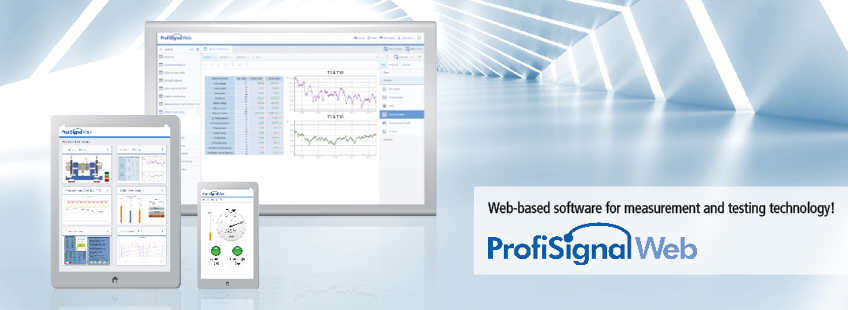
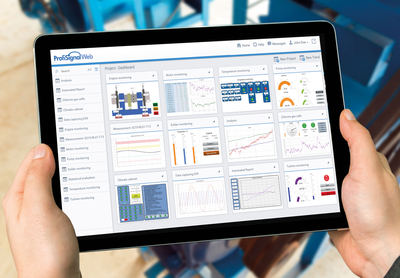
Important new features in ProfiSignal Web include the intuitive creation of views and the portrayal of important information in an easy to read dashboard. The dashboard can be accessed on a desktop, notebook, tablet or smartphone.
Faster overview of live data
ProfiSignal Web enables measurement data to be evaluated while it is being acquired. Key data such as machine utilisation, fault causes and downtimes are available live and can be clearly visualised within the dashboard. In this way, a dashboard provides a quick overview of ongoing process parameters.
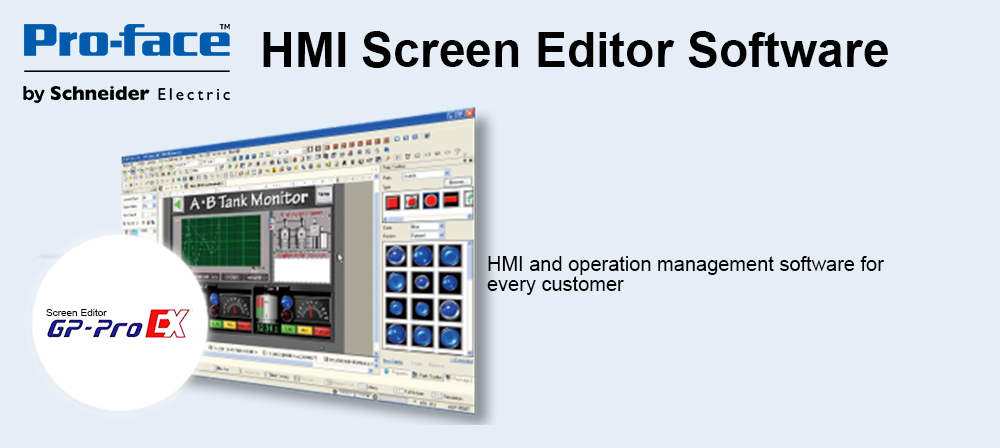
Fast and smooth trend portrayal
A special feature of ProfiSignal Web is the fast and smooth portrayal of trends in y(t) diagrams using current and historical measurement data and including a zoom option. Data from different sources and covering extended time periods can be displayed in the same diagram by utilising multiple independent y-axes.
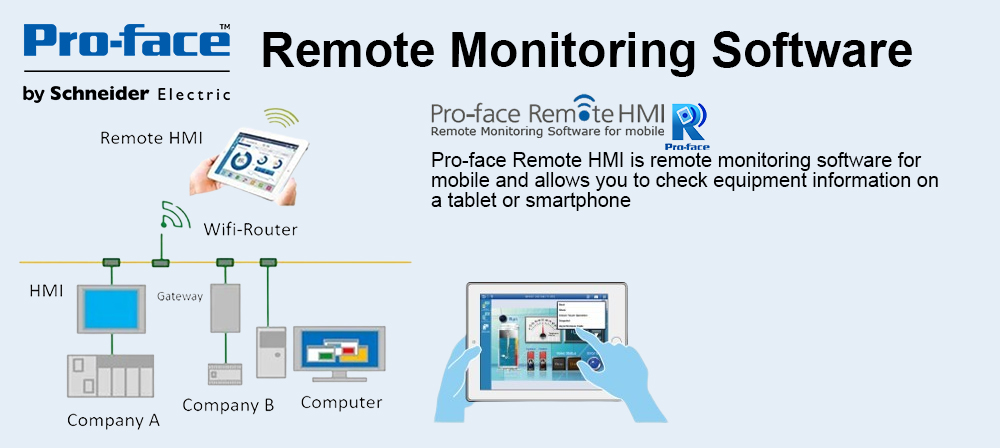
Dashboard creation without requiring programming expertise
An intuitive editor tool supports users in the creation of individualised dashboards. Individual views can be created using a large number of preconfigured visualisation elements. This enables quick portrayal of current trends, key data and important functions.
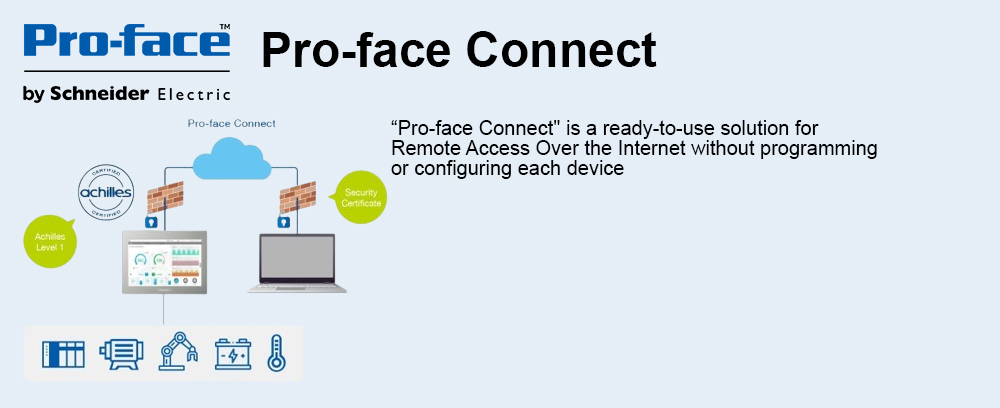
Practical, preconfigured visualisation elements
-
 Trend charts with trend curves for each active channel
-
Analog displays such as circular instruments
-
Bars with min/max displays
-
Circular displays, digital displays, traffic light elements
-
Slider switches and buttons with standard on/off functions